Drawing a tree with colored tips in R (ggtree)
Published:
ggtree is a R package designed for viewing and annotating phylogenetic trees. It is based on the ggplot2 package. Here I will show step-by-step how to draw a tree with colored tips, because, even thought the bioconductor documentation is clear and complete, I did not read about this very common visualization.
First, load a tree from a newick (or nexus) file:
library("ggplot2")
library("ggtree")

setwd("")

nwk <- ("tree.newick")
tree <- read.tree(nwk)
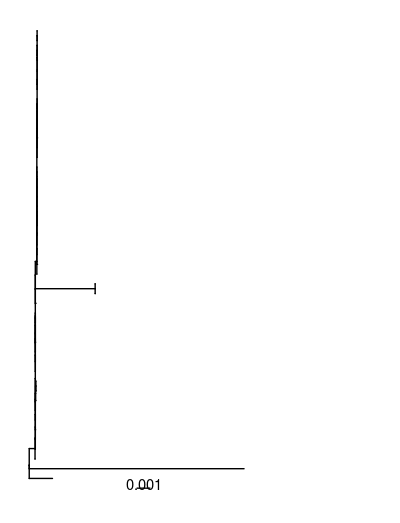
ggtree (tree)

I am happy with the default parameters layout = "rectangular", right = FALSE, ladderize = TRUE etc, but I would like a scale and more space for the labels:
p <- ggtree(tree) +
  xlim(0, 0.025) + # to allow more space for labels
  geom_treescale() # adds the scale

Now, I read in the metadata file (a tab delimited table):
tipcategories = read.csv("tree.meta",
                         sep = "\t",
                         col.names = c("seq", "cat"),
                         header = FALSE,
                         stringsAsFactors = FALSE)

dd = as.data.frame(tipcategories)
Thats how the first few rows of the data frame look like:
           seq          cat
1         E71T     Database
2        JS100     Outbreak
3        JS101     Outbreak
4       JS1017     Outbreak
5       JS1023     Outbreak
6       JS1057     Outbreak
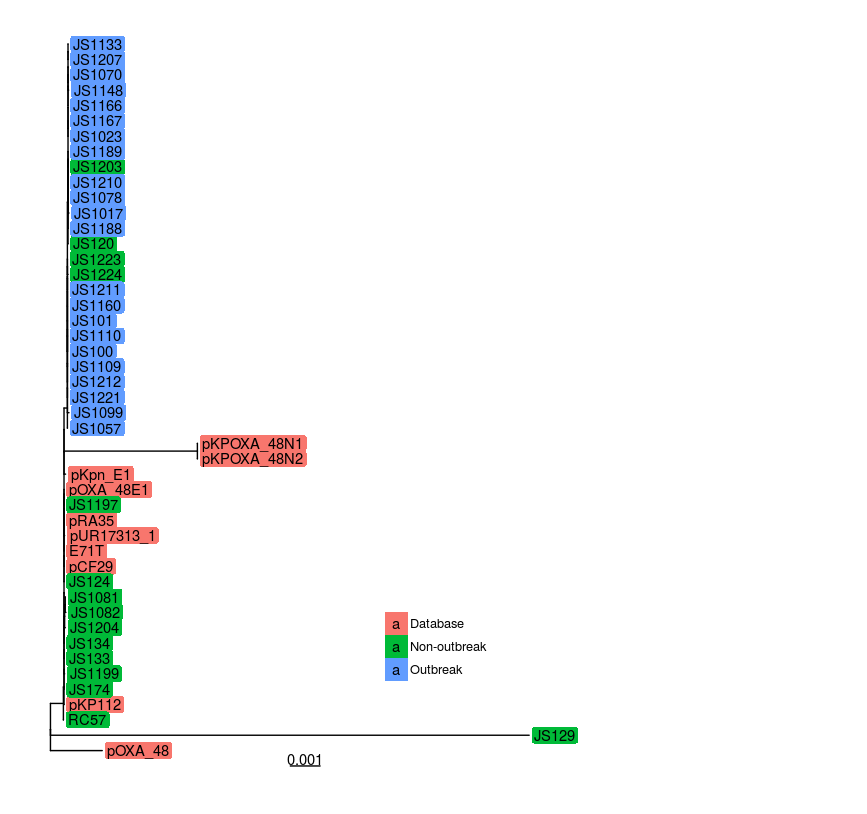
Now, I combine the tree with the metadata by adding a colored label to each tip, according to the sample category.
p %<+% dd +
  geom_tiplab(aes(fill = factor(cat)),
              color = "black", # color for label font
              geom = "label",  # labels not text
              label.padding = unit(0.15, "lines"), # amount of padding around the labels
              label.size = 0) + # size of label border
In addition, I would like a legend.
  theme(legend.position = c(0.5,0.2),
        legend.title = element_blank(), # no title
        legend.key = element_blank()) # no keys
And here is the resulting plot:

Links
G Yu, DK Smith, H Zhu, Y Guan, TTY Lam. ggtree: an R package for visualization and annotation of phylogenetic trees with their covariates and other associated data. Methods in Ecology and Evolution. 2017, 8(1):28-36.doi
https://guangchuangyu.github.io/ggtree/
