Assessing Read Quality and Trimming
Overview
Teaching: 30 min
Exercises: 20 minQuestions
How can I describe the quality of my data?
How can I get rid of sequence data that doesn’t meet my quality standards?
Objectives
Interpret a FastQC plot summarizing per-base quality across all reads.
Clean FastQC reads for further analysis.
Use
forloops to automate operations on multiple files.
Let’s check if yesterday’s download finished. Let’s have a look at the files
$ ls
ERR026473_1.fastq.gz  ERR026478_1.fastq.gz  ERR026482_1.fastq.gz  ERR029207_1.fastq.gz
ERR026473_2.fastq.gz  ERR026478_2.fastq.gz  ERR026482_2.fastq.gz  ERR029207_2.fastq.gz
ERR026474_1.fastq.gz  ERR026481_1.fastq.gz  ERR029206_1.fastq.gz  GCF_000195955.2_ASM19595v2_genomic.fna
ERR026474_2.fastq.gz  ERR026481_2.fastq.gz  ERR029206_2.fastq.gz
All new files start with ERR and have an fastq.gz extension. It means they are in fastq format and compressed. Let’s make a copy of one file and uncompress this file to inspect it further
cp ERR026473_1.fastq.gz ERR026473_1.copy.fastq.gz
gunzip ERR026473_1.copy.fastq.gz
Bioinformatics workflows
When working with high-throughput sequencing data, the raw reads you get off of the sequencer will need to pass through a number of different tools in order to generate your final desired output. The execution of this set of tools in a specified order is commonly referred to as a workflow or a pipeline.
An example of the workflow we will be using is provided below with a brief description of each step.
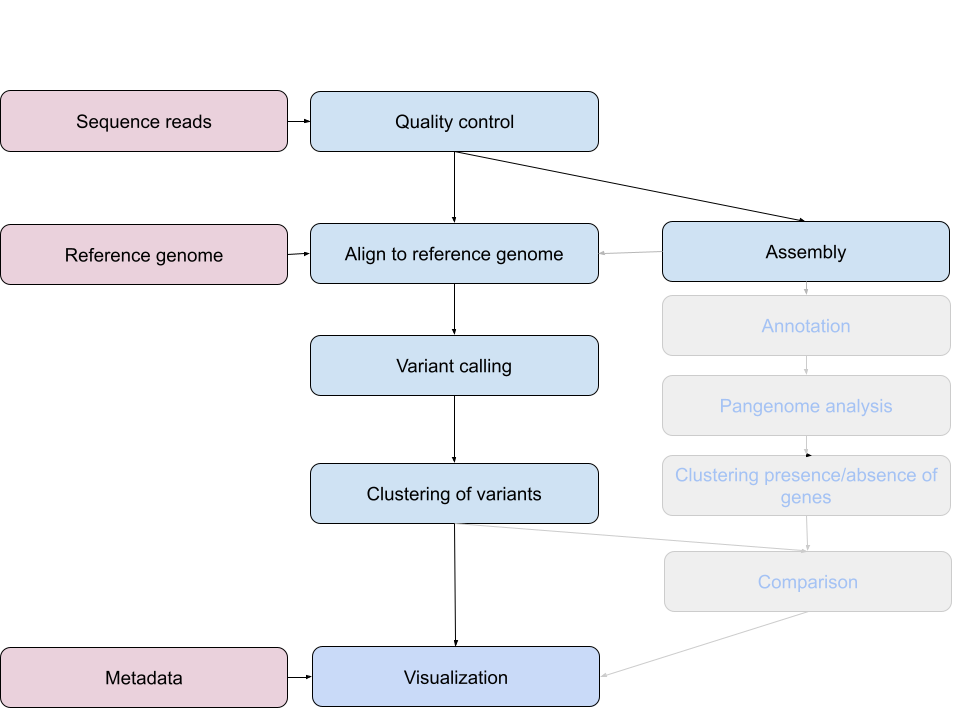
- Quality control - Assessing quality using FastQC
- Quality control - Trimming and/or filtering reads (if necessary)
- Align reads to reference genome - Snippy
- Variant calling - Snippy
-
Clustering variants - iTOL
- Assembly - SKESA
- Annotation (extra material)
- Pangenome analysis (extra material)
- Clustering presence and absence of genes (extra material)
-
Comparison of clustering methods (extra material)
- Data visualization - Microreact
These workflows in bioinformatics adopt a plug-and-play approach in that the output of one tool can be easily used as input to another tool without any extensive configuration. Having standards for data formats is what makes this feasible. Standards ensure that data is stored in a way that is generally accepted and agreed upon within the community. The tools that are used to analyze data at different stages of the workflow are therefore built under the assumption that the data will be provided in a specific format.
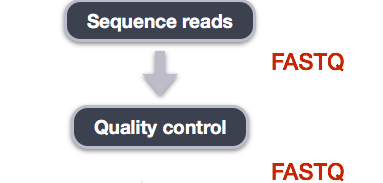
Quality Control
The first step in the variant calling workflow is to take the FASTQ files received from the sequencing facility and assess the quality of the sequence reads.
Details on the FASTQ format
Although it looks complicated (and it is), it’s easy to understand the fastq format with a little decoding. Some rules about the format include…
| Line | Description |
|---|---|
| 1 | Always begins with ‘@’ and then information about the read |
| 2 | The actual DNA sequence |
| 3 | Always begins with a ‘+’ and sometimes the same info in line 1 |
| 4 | Has a string of characters which represent the quality scores; must have same number of characters as line 2 |
We can view the first complete read in one of the files our dataset by using head to look at
the first four lines.
$ head -n4 ERR026481_1.copy.fastq
@ERR026481.1 IL10_5319:2:1:1934:947#8/1
NACCGGTCCAGCGCGCCCAGATCGAGCCCGTCGAGTCGGTCAACCGAAGTCACCGAACTTGTTTACCACTCGCGCAATGCCCGGCTTTAGCTCAGGCCGTCTACGTCT
+
%,,*,*,,,,1-24;;=6;69-1/1+1160566%11166/;/'5-3'132/1;56,/1/431)2245954&2-+83)6-%1)-1%,*++,1)6%'-%1/,45%,%,**
One of the nucleotides in this read is unknown (N).
Line 4 shows the quality for each nucleotide in the read. Quality is interpreted as the probability of an incorrect base call (e.g. 1 in 10) or, equivalently, the base call accuracy (eg 90%). To make it possible to line up each individual nucleotide with its quality score, the numerical score is converted into a code where each individual character represents the numerical quality score for an individual nucleotide. For example, in the line above, the quality score line is:
%,,*,*,,,,1-24;;=6;69-1/1+1160566%11166/;/'5-3'132/1;56,/1/431)2245954&2-+83)6-%1)-1%,*++,1)6%'-%1/,45%,%,**
The # character and each of the ! characters represent the encoded quality for an
individual nucleotide. The numerical value assigned to each of these characters depends on the
sequencing platform that generated the reads. The sequencing machine used to generate our data
uses the standard Sanger quality PHRED score encoding, using by Illumina version 1.8 onwards.
Each character is assigned a quality score between 0 and 40 as shown in the chart below.
Quality encoding: !"#$%&'()*+,-./0123456789:;<=>?@ABCDEFGHI
                  |         |         |         |         |
Quality score:    0........10........20........30........40
Each quality score represents the probability that the corresponding nucleotide call is incorrect. This quality score is logarithmically based, so a quality score of 10 reflects a base call accuracy of 90%, but a quality score of 20 reflects a base call accuracy of 99%. These probability values are the results from the base calling algorithm and dependent on how much signal was captured for the base incorporation.
Looking back at our read:
@ERR026481.1 IL10_5319:2:1:1934:947#8/1
NACCGGTCCAGCGCGCCCAGATCGAGCCCGTCGAGTCGGTCAACCGAAGTCACCGAACTTGTTTACCACTCGCGCAATGCCCGGCTTTAGCTCAGGCCGTCTACGTCT
+
%,,*,*,,,,1-24;;=6;69-1/1+1160566%11166/;/'5-3'132/1;56,/1/431)2245954&2-+83)6-%1)-1%,*++,1)6%'-%1/,45%,%,**
we can now see that the quality of an N is 4.
Quality Encodings Vary
Although we’ve used a particular quality encoding system to demonstrate interpretation of read quality, different sequencing machines use different encoding systems. This means that, depending on which sequencer you use to generate your data, a
#may not be an indicator of a poor quality base call.
This mainly relates to older Solexa/Illumina data, but it’s essential that you know which sequencing platform was used to generate your data, so that you can tell your quality control program which encoding to use. If you choose the wrong encoding, you run the risk of throwing away good reads or (even worse) not throwing away bad reads!
Assessing Quality using FastQC
In real life, you won’t be assessing the quality of your reads by visually inspecting your FASTQ files. Rather, you’ll be using a software program to assess read quality and filter out poor quality reads. We’ll first use a program called FastQC to visualize the quality of our reads. Later in our workflow, we’ll use another program to filter out poor quality reads.
FastQC has a number of features which can give you a quick impression of any problems your data may have, so you can take these issues into consideration before moving forward with your analyses. Rather than looking at quality scores for each individual read, FastQC looks at quality collectively across all reads within a sample. The image below shows a FastQC-generated plot that indicates a very high quality sample:
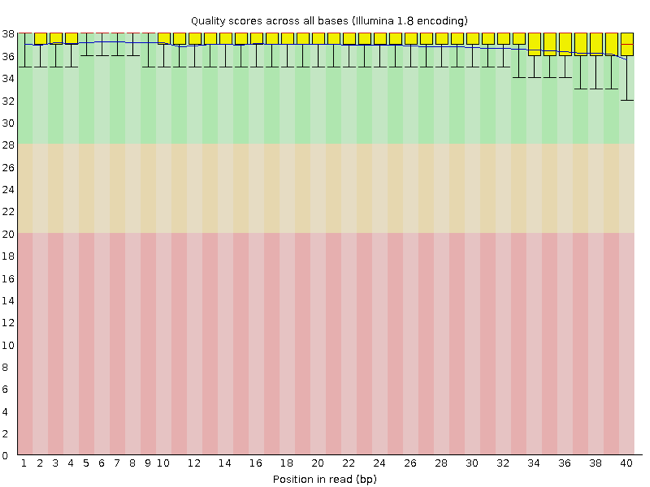
The x-axis displays the base position in the read, and the y-axis shows quality scores. In this example, the sample contains reads that are 40 bp long. For each position, there is a box-and-whisker plot showing the distribution of quality scores for all reads at that position. The horizontal red line indicates the median quality score and the yellow box shows the 2nd to 3rd quartile range. This means that 50% of reads have a quality score that falls within the range of the yellow box at that position. The whiskers show the range to the 1st and 4th quartile.
For each position in this sample, the quality values do not drop much lower than 32. This is a high quality score. The plot background is also color-coded to identify good (green), acceptable (yellow), and bad (red) quality scores.
Now let’s take a look at a quality plot on the other end of the spectrum.
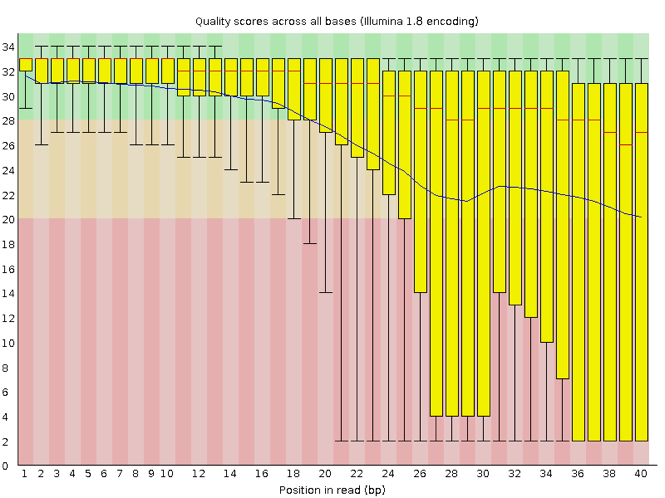
Here, we see positions within the read in which the boxes span a much wider range. Also, quality scores drop quite low into the “bad” range, particularly on the tail end of the reads. The FastQC tool produces several other diagnostic plots to assess sample quality, in addition to the one plotted above.
Running FastQC
Navigate to your FASTQ dataset:
$ cd ~/dc_workshop/data/
Exercise
Yesterday we downloaded 7 samples. How many FASTQ files are in this dataset? Why is this? What is the difference between the two files that start with the same name? Discuss with your neighbour.
Solution
There are 14 FASTQ files. Each sample has paired-end reads.
FastQC can accept multiple file names as input, so we can use the *.fastq wildcard to run FastQC on all of the FASTQ files in this directory.
$ fastqc *.fastq.gz
You will see an automatically updating output message telling you the progress of the analysis. It will start like this:
Started analysis of ERR026473_1.fastq.gz
Approx 5% complete for ERR026473_1.fastq.gz
Approx 10% complete for ERR026473_1.fastq.gz
Approx 15% complete for ERR026473_1.fastq.gz
Approx 20% complete for ERR026473_1.fastq.gz
Approx 25% complete for ERR026473_1.fastq.gz
Approx 30% complete for ERR026473_1.fastq.gz
Approx 35% complete for ERR026473_1.fastq.gz
Approx 40% complete for ERR026473_1.fastq.gz
Approx 45% complete for ERR026473_1.fastq.gz
Approx 50% complete for ERR026473_1.fastq.gz
Approx 55% complete for ERR026473_1.fastq.gz
Approx 60% complete for ERR026473_1.fastq.gz
Approx 65% complete for ERR026473_1.fastq.gz
Approx 70% complete for ERR026473_1.fastq.gz
Approx 75% complete for ERR026473_1.fastq.gz
In total, it should take about five to ten minutes for FastQC to run on all fourteen of our FASTQ files. When the analysis completes, your prompt will return. So your screen will look something like this:
Approx 90% complete for ERR029207_2.fastq.gz
Approx 95% complete for ERR029207_2.fastq.gz
Analysis complete for ERR029207_2.fastq.gz
molepi30@lp0106:~/dc_workshop/data$
The FastQC program has created several new folders and zip files within our
/data/ directory.
$ ls
2_asm19595v2_genomic.infoalign  ERR026481_2_fastqc.html
ERR026473_1.copy.fastq          ERR026481_2_fastqc.zip
ERR026473_1_fastqc.html         ERR026481_2.fastq.gz
ERR026473_1_fastqc.zip          ERR026482_1_fastqc.html
ERR026473_1.fastq.gz            ERR026482_1_fastqc.zip
ERR026473_2_fastqc.html         ERR026482_1.fastq.gz
ERR026473_2_fastqc.zip          ERR026482_2_fastqc.html
ERR026473_2.fastq.gz            ERR026482_2_fastqc.zip
ERR026474_1_fastqc.html         ERR026482_2.fastq.gz
ERR026474_1_fastqc.zip          ERR029206_1_fastqc.html
ERR026474_1.fastq.gz            ERR029206_1_fastqc.zip
ERR026474_2_fastqc.html         ERR029206_1.fastq.gz
ERR026474_2_fastqc.zip          ERR029206_2_fastqc.html
ERR026474_2.fastq.gz            ERR029206_2_fastqc.zip
ERR026478_1_fastqc.html         ERR029206_2.fastq.gz
ERR026478_1_fastqc.zip          ERR029207_1_fastqc.html
ERR026478_1.fastq.gz            ERR029207_1_fastqc.zip
ERR026478_2_fastqc.html         ERR029207_1.fastq.gz
ERR026478_2_fastqc.zip          ERR029207_2_fastqc.html
ERR026478_2.fastq.gz            ERR029207_2_fastqc.zip
ERR026481_1_fastqc.html         ERR029207_2.fastq.gz
ERR026481_1_fastqc.zip          GCF_000195955.2_ASM19595v2_genomic.fna
ERR026481_1.fastq.gz
For each input gzipped FASTQ file, FastQC has created a .zip file and a
.html file. The .zip file extension indicates that this is
actually a compressed set of multiple output files. We’ll be working
with these output files soon. The .html file is a stable webpage
displaying the summary report for each of our samples.
We want to keep our data files and our results files separate, so we
will move these
output files into a new directory within our results/ directory.
$ mkdir ~/dc_workshop/results/fastqc_untrimmed_reads
$ mv *.zip ~/dc_workshop/results/fastqc_untrimmed_reads/
$ mv *.html ~/dc_workshop/results/fastqc_untrimmed_reads/
Now we can navigate into this results directory and do some closer inspection of our output files.
$ cd ~/dc_workshop/results/fastqc_untrimmed_reads/
Viewing HTML files
If we were working on our local computers, we’d be able to display each of these HTML files as a webpage:
$ open ERR026473_1_fastqc.html
However, if you try this on our server, you’ll get an error:
Couldn't get a file descriptor referring to the console
This is because the server we’re using doesn’t have any web browsers installed on it, so the remote computer doesn’t know how to open the file. We want to look at the webpage summary reports, so let’s transfer them to our local computers (i.e. your laptop).
Moving files between your instance and your laptop
We need to get the html files we produced to our own computers.There are also several ways to do this, but we will use the Jupyter web-interface.
Go back to your Jupyter web-interface and press the refresh button on the top left. Search the directory ‘dc_workshop’, enter the ‘data’ directory and click on all .html files. Now you can download them with the download button.
Now we can go to your Download directory on your own computer and open the HTML files.
Exercise
Discuss your results with a neighbor. Which sample(s) looks the best in terms of per base sequence quality? Which sample(s) look the worst?
Solution
All samples are of reasonable quality.
Exercise
What are the read lengths of the different samples? Fill in in the table under the header ‘Read length’
Cleaning Reads
It’s very common to have some reads within a sample, or some positions (near the beginning or end of reads) across all reads that are low quality and should be discarded. We will use a program called seqtk to filter poor quality reads and trim poor quality bases from our samples.
Seqtk Options
Seqtk is a program written C and aims to be a Swiss army knife for sequencing reads. You don’t need to learn C to use Seqtk, but the fact that it’s a C program helps explain the syntax that is used to run Seqtk. Seqtk takes as input files either FASTQ files or gzipped FASTQ files and outputs FASTQ or FASTA files. The basic command to run Seqtk starts like this:
$ seqtk
That’s just the basic command, however. Seqtk has a variety of options and parameters. We will need to specify what options we want to use for our analysis. Here are some of the options:
| option | meaning |
|---|---|
seq |
common transformation of FASTA/Q |
comp |
get the nucleotide composition of FASTA/Q |
trimfq |
trim FASTQ using the Phred algorithm |
In addition to these options, there are a number if trimming options available:
$ seqtk trimfq
| step | meaning |
|---|---|
-q |
error rate threshold (disabled by -b/-e) [0.05] |
-l |
maximally trim down to INT bp (disabled by -b/-e) [30] |
-b |
trim INT bp from left (non-zero to disable -q/-l) [0] |
-e |
trim INT bp from right (non-zero to disable -q/-l) [0] |
We will use only a few of these options in our analysis. It is important to understand the steps you are using to clean your data.
A complete command for trimming with seqtk will look something like this:
$ seqtk trimfq -q 0.01 ERR01_1.fastq.gz > ERR01_1_trim.fastq
Trimming
Now we will run seqtk trimfq on our data. To begin, navigate to your untrimmed_fastq data directory:
$ cd ~/dc_workshop/data/
We are going to run seqtk on one sample giving it an error rate threshold of 0.01 which indicates the base call accuracy. We request that, after trimming, the chances that a base is called incorrectly are only 1 in 10000.
$ seqtk trimfq -q 0.01 ERR026473_1.fastq.gz > ERR026473_1_trim.fastq
Notice that we needed to redirect the output to a file. If we don’t do that, the trimmed fastq data will be displayed in the console.
Exercise
Use seqtk fqchk to compare the untrimmed and trimmed reads of ERR026473_1 in terms of number of sequenced bases, percentage of A,G,C,T and N and average quality. What do you notice? Discuss with your neighbor.
Solution
1)
seqtk fqchk ERR026473_1_copy.fastq | head -n 3min_len: 108; max_len: 108; avg_len: 108.00; 33 distinct quality values
POS #bases %A %C %G %T %N avgQ errQ %low %high
ALL 229930596 17.9 32.2 32.3 17.4 0.2 29.7 20.6 6.9 93.1
2)
seqtk fqchk ERR026473_1_trim.fastq | head -n 3min_len: 30; max_len: 108; avg_len: 94.31; 33 distinct quality values
POS #bases %A %C %G %T %N avgQ errQ %low %high
ALL 200776204 17.9 32.2 32.2 17.6 0.0 31.2 28.5 1.3 98.7
We’ve just successfully trimmed one of our FASTQ files!
However, there is some bad news. seqtk can only operate on
one sample at a time and we have more than one sample. The good news
is that we can use a for loop to iterate through our sample files
quickly!
$ for infile in *.fastq.gz
> do
> outfile="${infile}"_trim.fastq
> seqtk trimfq -q 0.01 "${infile}" >  "${outfile}"
> done
The new part in our for loop is the line:
> outfile="${infile}"_trim.fastq
infile is the first variable in our loop and takes the value
of each of the FASTQ files in our directory. outfile is the
second variable in our loop and is defined by adding _trim.fastq to
the end of our input file name. Use {} to wrap the variable so that _trim.fastq will
not be interpreted as part of the variable name. In addition, quoting the shell variables is
a good practice AND necessary if your variables have spaces in them.
For more, check Bash Pitfalls.
There are no spaces before or after the =.
Go ahead and run the for loop. It should take a few minutes for seqtk to run for each of our fourteen input files. Once it’s done running, take a look at your directory contents.
$ ls
2_asm19595v2_genomic.infoalign   ERR026481_2.fastq.gz
ERR026473_1.copy.fastq           ERR026481_2.fastq.gz_trim.fastq
ERR026473_1.fastq.gz             ERR026482_1.fastq.gz
ERR026473_1.fastq.gz_trim.fastq  ERR026482_1.fastq.gz_trim.fastq
ERR026473_2.fastq.gz             ERR026482_2.fastq.gz
ERR026473_2.fastq.gz_trim.fastq  ERR026482_2.fastq.gz_trim.fastq
ERR026474_1.fastq.gz             ERR029206_1.fastq.gz
ERR026474_1.fastq.gz_trim.fastq  ERR029206_1.fastq.gz_trim.fastq
ERR026474_2.fastq.gz             ERR029206_2.fastq.gz
ERR026474_2.fastq.gz_trim.fastq  ERR029206_2.fastq.gz_trim.fastq
ERR026478_1.fastq.gz             ERR029207_1.fastq.gz
ERR026478_1.fastq.gz_trim.fastq  ERR029207_1.fastq.gz_trim.fastq
ERR026478_2.fastq.gz             ERR029207_2.fastq.gz
ERR026478_2.fastq.gz_trim.fastq  ERR029207_2.fastq.gz_trim.fastq
ERR026481_1.fastq.gz             GCF_000195955.2_ASM19595v2_genomic.fna
ERR026481_1.fastq.gz_trim.fastq
We’ve now completed the trimming and filtering steps of our quality
control process! Before we move on, let’s move our trimmed FASTQ files
to a new subdirectory within our data/ directory.
$ cd ~/dc_workshop/data/
$ mkdir trimmed_fastq
$ mv *_trim* trimmed_fastq
$ cd trimmed_fastq
$ ls
ERR026473_1.fastq.gz_trim.fastq  ERR026478_2.fastq.gz_trim.fastq  ERR029206_1.fastq.gz_trim.fastq
ERR026473_2.fastq.gz_trim.fastq  ERR026481_1.fastq.gz_trim.fastq  ERR029206_2.fastq.gz_trim.fastq
ERR026474_1.fastq.gz_trim.fastq  ERR026481_2.fastq.gz_trim.fastq  ERR029207_1.fastq.gz_trim.fastq
ERR026474_2.fastq.gz_trim.fastq  ERR026482_1.fastq.gz_trim.fastq  ERR029207_2.fastq.gz_trim.fastq
ERR026478_1.fastq.gz_trim.fastq  ERR026482_2.fastq.gz_trim.fastq
Challenge
Again, use seqtk fqchk to compare the untrimmed and trimmed reads of all samples. Note the number of bases ‘#bases’ of the trimmed and untrimmed reads. Calculate the theoretical coverage of the genomes before and after trimming, assuming that all our genomes do have the same size as our reference genome (4411532 bases). Fill into the table.
Hint: Sum up forward and reverse reads!
Solution
1)
seqtk fqchk ERR026473_1.fastq_trim.fastq | head -n 3min_len: 108; max_len: 108; avg_len: 108.00; 33 distinct quality values POS #bases %A %C %G %T %N avgQ errQ %low %high ALL 229930596 17.9 32.2 32.3 17.4 0.2 29.7 20.6 6.9 93.1
seqtk fqchk ERR026473_2.fastq_trim.fastq | head -n 3min_len: 108; max_len: 108; avg_len: 108.00; 33 distinct quality values POS #bases %A %C %G %T %N avgQ errQ %low %high ALL 220040502 17.9 32.2 32.3 17.4 0.2 29.7 20.6 6.9 93.1
Coverage before trimming = #bases (forward + reverse) / genome size 101.10 = (229930596 + 220040502) / 4411532
Key Points
In bioinformatic workflows the output of one tool is the input of the other.
FastQC is used to judge the quality of sequencing reads.
Data cleaning is an essential step in a genomics pipeline.