SNP phylogeny
Overview
Teaching: 15 min
Exercises: 60 minQuestions
How to generate a phylogenetic tree from SNP data?
Objectives
Map reads against a reference genome
Extract single nucleotide polymorphisms
Establish a phylogenetic tree from the SNP data
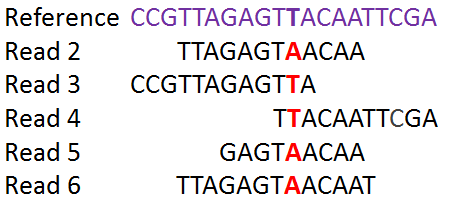
In this episode we will try to pinpoint single nucleotide variants or single nucleotide polymorphism (SNPs) between our samples and the reference. The SNPs are determined by a process called read mapping in which they are aligned to the reference sequence.
The identified SNPs will be used to compare the isolates to each other and to establish a phylogenetic tree.
Starting a new screen session
Again we will use a ‘screen session’ to do our calculation in the background. You can start a session and give it a descriptive name:
$ screen -S snp
This creates a session with the name ‘snp’
As you work, this session will stay active until you close this session. Even if you disconnect from your machine, the jobs you start in this session will run till completion.
SNP calling
SNIPPY is a pipeline that contains different tools to determine SNPs in sequencing reads against a reference genome. It takes forward and reverse reads of paired-end sequences and aligns them against a reference.
It is very fast but a single run of SNIPPY still takes about 10 to 12 minutes. We will therefore tell SNIPPY to run all the samples after each other. However this time we can not use a wildcard to do so. We will instead run all the samples in a loop.
$ cd ~/dc_workshop/data/trimmed_fastq/
$ for sample in ERR026473 ERR026474 ERR026478 ERR026481 ERR026482 ERR029206 ERR029207
>  do
>  snippy  --outdir ~/dc_workshop/results/snps/"${sample}" \
--ref ~/dc_workshop/data/GCF_000195955.2_ASM19595v2_genomic.fna \
--cpus 1 \
--R1 "${sample}"_1.fastq.gz_trim.fastq \
--R2 "${sample}"_2.fastq.gz_trim.fastq
>  done
Detach session (process keeps running in background)
You can detach from a session by pressing control + a followed by d (for detach) on your keyboard.
You can now safely work on a different task or log out of your machine. The assembly will keep on running.
After the run is finished we can check the results.
$ head -n10 ~/dc_workshop/results/snps/ERR029207/snps.tab
CHROM	POS	TYPE	REF	ALT	EVIDENCE	FTYPE	STRAND	NT_POS	AA_POS	EFFECT	LOCUS_TAG	GENE	PRODUCT
NC_000962.3	1849	snp	C	A	A:225 C:0
NC_000962.3	1977	snp	A	G	G:130 A:0
NC_000962.3	4013	snp	T	C	C:136 T:0
NC_000962.3	7362	snp	G	C	C:141 G:0
NC_000962.3	7585	snp	G	C	C:136 G:0
NC_000962.3	9304	snp	G	A	A:128 G:0
NC_000962.3	11820	snp	C	G	G:165 C:0
NC_000962.3	11879	snp	A	G	G:107 A:0
NC_000962.3	14785	snp	T	C	C:180 T:0
This list gives us information on every SNP that was found by SNIPPY when compared to the reference genome. The first SNP is found at the position 1849 of the reference genome, and is a C in the H37Rv and an A in isolate ERR029207. There is a high confidence associated with this SNP: an A has been found 225 times in the sequencing reads and never a C at this position.
Challenge: How many SNPs were identified in each sample??
Find out how many SNPs were identified in the M. tuberculosis isolates when compared to H37Rv. Enter your solution in the table under the head ‘Number of SNPs’.
Hint: The .txt file in the SNIPPY output contains summary information
Solution
$ head .-n10 ~/dc_workshop/results/snps/ERR029207/snps.txt

DateTime	2018-01-09T13:34:32
ReadFiles	/home/dcuser/dc_workshop/data/ERR029207_1.fastq.gz /home/dcuser/dc_workshop/data/ERR029207_2.fastq.gz
Reference	/home/dcuser/dc_workshop/data/GCF_000195955.2_ASM19595v2_genomic.fna
ReferenceSize	4485121
Software	snippy 3.2-dev
Variant-COMPLEX	29
Variant-DEL	54
Variant-INS	37
Variant-MNP	7
Variant-SNP	1292

This *M. tuberculosis* isolate contains 1292 SNPs compared to H37Rv.

Repeat this for the other isolates.
Core SNPs
In order to compare the identified SNPs with each other we need to know if a certain position exists in all isolates. A core site can have the same nucleotide in every sample (monomorphic) or some samples can be different (polymorphic). SNIPPY will concatenate the core SNPs, i.e. ignoring sites that are monomorphic in all isolates and in the reference. Concatenation of the SNP sites reduces the size of the alignment considerably.
The ‘–noref’ argument tells SNIPPY to exclude the reference from the alignment.
The ‘–aformat’ argument determines the alignment output format. We need a phylip format as input for our next tool.
$ cd ~/dc_workshop/results/snps/
$ snippy-core --noref --aformat=phylip ERR026473 ERR026474 ERR026478 ERR026481 ERR026482 ERR029206 ERR029207
The last few lines look like this:
...
[08:20:35] Will write alignment statistics to core.txt
[08:20:35] Loading pre-masked/aligned sequences...
[08:20:35] 1/7	ERR026473 coverage 4243097/4411532 = 96.18%
[08:20:35] 2/7	ERR026474 coverage 4247216/4411532 = 96.28%
[08:20:35] 3/7	ERR026478 coverage 4262038/4411532 = 96.61%
[08:20:35] 4/7	ERR026481 coverage 4245636/4411532 = 96.24%
[08:20:35] 5/7	ERR026482 coverage 4240999/4411532 = 96.13%
[08:20:35] 6/7	ERR029206 coverage 4245210/4411532 = 96.23%
[08:20:35] 7/7	ERR029207 coverage 4256440/4411532 = 96.48%
[08:20:35] Patching variant sites into whole genome alignment...
[08:20:35] Constructing alignment object for core.full.aln
[08:20:36] Writing 'phylip' alignment to core.full.aln
[08:20:41] Writing core SNP table
[08:20:41] Found 395 core SNPs from 1733 variant sites.
[08:20:41] Saved SNP table: core.tab
[08:20:41] Constructing alignment object for core.aln
[08:20:41] Writing 'phylip' alignment to core.aln
[08:20:41] Done.
Our output in phylip format was written to ‘core.aln’. But let’s have a look at the results.
Discussion: What’s in the output of SNIPPY??
Have a look at the content of these three files with ‘cat’ or ‘head’.
‘core.aln’
‘core.full.aln’
‘core.nway.tab’
What is the difference between these files? Why is core.aln smaller? What is in core.aln?
Phylogenetic tree
Phylogenetic trees have been discussed during the lectures. We will here establish a phylogenetic tree from the file ‘core.aln’ with PhyML. PhyML is a phylogeny software based on the maximum-likelihood principle. Since the original publication, PhyML has been widely used and cited. There is a range of parameters that need to be chosen, such as nucleotide or amino-acid substitution model (see the web-version of PhyML but for simplicity we will run PhyML with standard parameters.
$ phyml -i core.aln
...
. Log likelihood of the current tree: -1807.238286.

. Compute fast branch supports on the most likely tree...

. Printing the most likely tree in file 'core.aln_phyml_tree.txt'...

. Time used 0h0m1s

oooooooooooooooooooooooooooooooooooooooooooooooooooooooooooooooooooooooooooooooooooooooooooooooo
With this small data set, PhyML finishes very quickly. Let’s put the resulting files into a separate folder and let’s rename our resulting tree.
$ mkdir tree
$ mv core.aln_phyml_stats tree/
$ mv core.aln_phyml_tree tree/core_snps.newick
Let’s inspect our tree.
$ cd ~/dc_workshop/results/snps/
$ cd tree
$ head -n10 core_snps.newick
(ERR026481:0.00000001,ERR026482:0.00767108,((ERR026473:0.31329695,ERR026474:0.26681667)0.921000:0.15635534,(ERR026478:0.00000012,(ERR029207:0.00000001,ERR029206:0.00504197)0.000000:0.00000001)1.000000:0.58688282)1.000000:0.41758464);
This does not look much like a tree yet. The tree is written in a bracket annotation, the Newick format. In order to make sense of it we can better view this in a tree viewer. For this, we need to copy the core_snps.newick file to our own computer.
Visualization of phylogenetic trees
We will be using iTOL to view the phylogenetic tree established from the core SNPs. iTOL is a tree viewer which allows to display, annotate and management of phylogenetic and other trees, especially very large tree. First, download the core_snps.newick file to your own computer, then go to iTOL and upload your tree. Do play around with the different tree visualization options (‘MODE’) until you find a clear clustering.
Challenge: Which isolates are related based on core SNPs?
Try to make three groups out of the 7 isolates.
Solution
3 groups:
..
..
..
Extra challenge: How does the clustering change when aligning the assembled contigs to the reference genome?
Align the assembled contigs to the reference genome with snippy. Produce a core genome alignment and a phylogenetic tree as done previously for the reads. How many SNPs were identified by SNIPPY when compared to the reference strain? More or less than for read alignment? Why?
$ for sample in ERR026473 ERR026474 ERR026478 ERR026481 ERR026482 ERR029206 ERR029207
do
snippy --outdir ~/dc_workshop/results/snps/"${sample}"_contigs --ref ~/dc_workshop/data/GCF_000195955.2_ASM19595v2_genomic.fna --contigs ~/dc_workshop/results/assembly/"${sample}".fasta
done
head -n 10 ~/dc_workshop/results/snps/*contigs/snps.txt
...
snippy-core --noref --aformat=phylip ERR026473_contigs ERR026474_contigs ERR026478_contigs ERR026481_contigs ERR026482_contigs ERR029206_contigs ERR029207_contigs
phyml -i core.aln
mv core.aln_phyml_tree tree/core_snps_contigs.newick
Key Points
Single nucleotide polymorphisms can be identified by mapping reads to a reference genome
Parameters for the analysis have to be selected based on expected outcomes for this organism
Concatenation of SNPs helps to reduce analysis volume
Phylogenetic trees can be written with a bracket syntax in Newick format